


Hitting statistics serve as the key metrics for front offices, college recruiters, and fans across the US to gauge a player's capabilities at the plate. Today, we will take a look at all of the different hitting statistics. Starting with fundamental hitting statistics and progressing to advanced situational metrics, these statistics provide tailored insights into a batter's ability to make contact, generate runs, and contribute to their team’s offensive success.
Basic Statistics
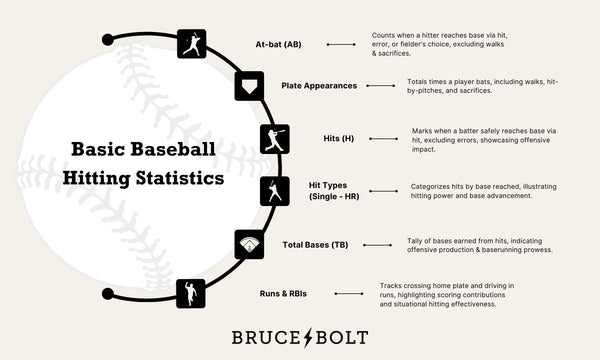
What is an At-bat (AB)?
An at-bat is credited to a hitter when they reach base through a hit, an error, or a fielder's choice, or when they are put out on a non-sacrifice play. However, at-bats do not include walks, hit-by-pitch, or sacrifice outs. At-bats serve as the basis for calculating batting average and slugging percentage, two essential metrics in assessing a batter's performance at the plate.
What are Plate Appearances (PA)?
Plate appearance counts the total number of times a player comes up to bat, including at-bats, walks, hit-by-pitches, sacrifices, and catcher's interference. It provides a comprehensive view of a player's offensive involvement and contribution to the team's performance.
What is a Hit (H)?
Hits occur when a batter successfully hits the ball into play and reaches base safely (without an error being made). Whether it's a line drive, a well-placed bunt, or a home run, each hit is registered the same under this metric.
What are Singles (1B), Doubles (2B), Triples (3B), and Home Runs (HR)?
These statistics categorize hits based on the base a batter reaches when they get a hit (again, excluding errors). Singles (1st base), doubles (2nd base), triples (3rd base), and home runs (touch ’em all) tell you how many of each type of hit a player has.
What is Total Bases (TB)?
Total bases represent the cumulative number of bases a player earns from their hits over the course of a game, season, or career. It provides a simple yet effective measure of a player's offensive production and base running ability.
What is the Meaning of Runs (R) and Runs Batted In (RBI)?
Runs (R) represents the number of times a player crosses home plate, contributing to their team's scoring total. Runs batted in (RBI) measure a batter's effectiveness in driving in runs, reflecting their ability to capitalize with runners in scoring position.
Understanding these basic hitting statistics provides a foundation for evaluating a batter's overall performance at the plate. Beyond being insightful statistics on their own, many of our advanced statistics are built on these fundamental metrics.
Exploring Advanced Hitting Metrics
In addition to basic hitting statistics, advanced metrics (or sabermetrics) provide a deeper understanding of a player's performance and contribution to their team's success. Let's dive into these advanced statistics to gain insights into different aspects of hitting proficiency.
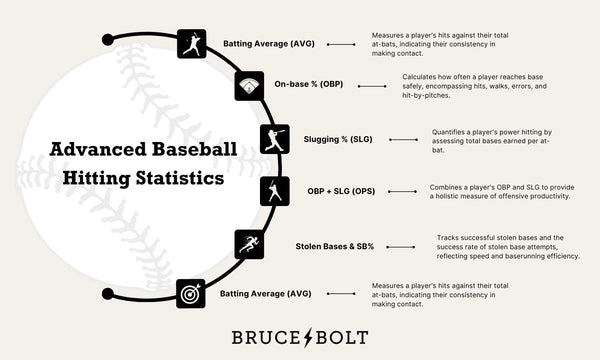
What is Batting Average (AVG)?
Batting average measures a player's hits relative to their total number of at-bats. It's calculated by dividing the total number of hits by the total number of at-bats. Batting average is a widely recognized metric for assessing a player's ability to make consistent contact with the ball.
What is On-base Percentage (OBP)?
On-base percentage calculates the frequency with which a player reaches base safely, including hits, walks, errors, and hit-by-pitches. It provides a comprehensive view of a player's ability to get on base and sustain offensive rallies. Similar to batting average, OBP is calculated by dividing the total number of times a player reaches base by their total plate appearances.
What is Slugging Percentage (SLG)?
Slugging percentage quantifies a player's power hitting ability by measuring the number of total bases earned per at-bat. It's calculated by dividing the total number of bases earned by the total number of at-bats. SLG offers valuable insights into a player's ability to hit for power.
What is On-base Plus Slugging (OPS)?
Popularized by Billy Beane and the “Moneyball” A’s team, OPS combines a player's on-base percentage and slugging percentage to provide a comprehensive measure of offensive productivity. It's calculated by adding together OBP and SLG. OPS offers a holistic view of a player's overall offensive impact, considering both their ability to reach base and hit for power.
What is Stolen Base (SB) and Stolen-base Percentage (SB%)?
Stolen base measures a player's total number of successful stolen bases, while stolen-base percentage calculates the success rate (%) of stolen base attempts. These metrics assess a player's speed and base running efficiency.
What is Caught Stealing (CS)?
Caught stealing measures the number of times a player is tagged out while attempting to steal a base. It reflects a player's aggressiveness and success on the base paths.
By understanding these advanced hitting metrics, we gain a deeper knowledge of a player's offensive prowess and their impact on the game.
Analyzing Situational Hitting Statistics
Understanding situational hitting statistics provides insight into a player's performance in specific game scenarios. Let's explore these situational metrics to gain a comprehensive understanding of a player's versatility and adaptability at the plate.
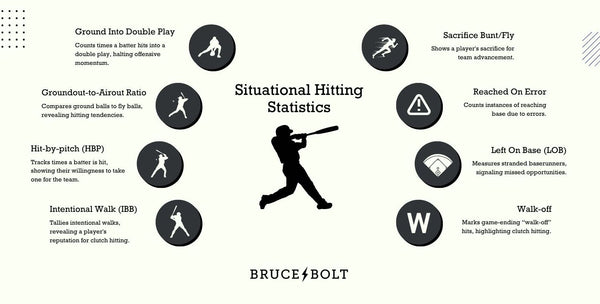
What is Ground Into Double Play (GIDP)?
Ground into double play calculates the number of times a batter hits into a double play, resulting in two outs for the defensive team. It highlights a player's ability to avoid hitting into unfavorable situations and sustain offensive momentum.
What is Groundout-to-Airout Ratio (GO/AO)?
Groundout-to-airout ratio compares the number of ground balls hit by a player to the number of fly balls. It provides insights into a player's miss tendency when they are unsuccessful at the plate. Typically, power hitters are prone to airouts while contact hitters tend to ground out more frequently.
What is Hit-by-pitch (HBP)?
Hit-by-pitch measures the number of times a batter is struck by a pitch thrown by the opposing pitcher. It reflects a player's willingness to take pitches and potentially reach base. If you (like the rest of us) do not enjoy getting hit by a pitch, check out our premium protective gear to keep yourself protected at the plate!
What is an Intentional Walk (IBB)?
The intentional walk statistic counts the number of times a batter is purposefully walked by the opposing team's pitcher to avoid facing them in a critical situation. It underscores a player's reputation and impact on opposing teams' strategies.
What is Sacrifice Bunt (SH) and Sacrifice Fly (SF)?
Sacrifice bunts and sacrifice flies measure a player's ability to execute strategic plays to advance baserunners and score runs. These situational hitting tactics demonstrate a player's selflessness and commitment to team success.
What is Reached On Error (ROE)?
Reached on error counts the number of times a batter reaches base due to an error committed by the defensive team. It showcases a player's ability to capitalize on defensive mistakes.
What is Left On Base (LOB)?
Left on base measures the number of baserunners a player leaves stranded at the end of an inning. It reflects a player's inability to drive in runs and capitalize on scoring opportunities with runners in scoring position (opposite of RBIs).
What is a Walk-off?
Walk-off represents a game-ending hit that results in a win for the player's team. It signifies a player's clutch performance and ability to deliver in pressure-packed situations, securing wins for their team.
By analyzing these situational hitting statistics, we gain valuable insights into a player's adaptability, versatility, and performance under various game scenarios.
Around the Horn: Baseball Hitting Statistics
Baseball hitting statistics serve as crucial metrics for evaluating player performance and strategizing for success on the field. By understanding both basic and advanced metrics fans, coaches, and recruiters alike can gain valuable insights into a batter's offensive capabilities and their contribution to team success.
From batting average to on-base percentage, and from stolen bases to situational hitting performance, each statistic offers a unique perspective on a player's skill set and effectiveness at the plate. These numbers not only quantify individual achievements but also shape the way teams approach their game plan and roster decisions.

Take Your Game to the Next Level with BRUCE BOLT!
As you continue to explore the world of baseball hitting statistics, remember the importance of equipping yourself with the right gear to maximize your performance on the field. That's where BRUCE BOLT comes in.
BRUCE BOLT's premium products include batting gloves, arm sleeves, apparel, and more. Built with quality craftsmanship and performance-enhancing designs, BRUCE BOLT gear empowers players to take their game to the next level.
Don't settle for anything less than excellence – choose BRUCE BOLT!