


The Short Answer: WHIP (Walks plus Hits per Inning Pitched) is a baseball statistic that measures a pitcher's effectiveness by calculating how many baserunners they allow per inning. A low WHIP below 1.10 is considered excellent in Major League Baseball, while anything above 1.30 suggests a pitcher's performance is struggling.
In the world of baseball analytics, WHIP has become one of the most telling advanced metrics for evaluating a pitcher's ability. This straightforward statistic reveals how well a pitcher controls the game by tracking the number of base runners who reach through walks or hits. Unlike Earned Run Average (ERA), which only counts when runners score, the WHIP statistic shows how frequently a pitcher allows potential scoring opportunities.
This article will break down everything baseball fans need to know about WHIP: how it's calculated, what makes a good WHIP, how it compares to other advanced stats, and why it matters for evaluating talent. Whether you're a player, coach, or fantasy baseball enthusiast, understanding WHIP will help you better analyze pitching performance and recognize truly dominant hurlers on the mound.
The Fundamentals of WHIP
Definition and Basic Concept
WHIP, a key baseball statistic in advanced metrics, stands for Walks plus Hits per Inning Pitched, measuring a pitcher's ability to prevent baserunners. This sabermetric statistic shows how many base runners a pitcher allows per inning through walks and hits, making it a valuable tool for evaluating pitcher effectiveness.
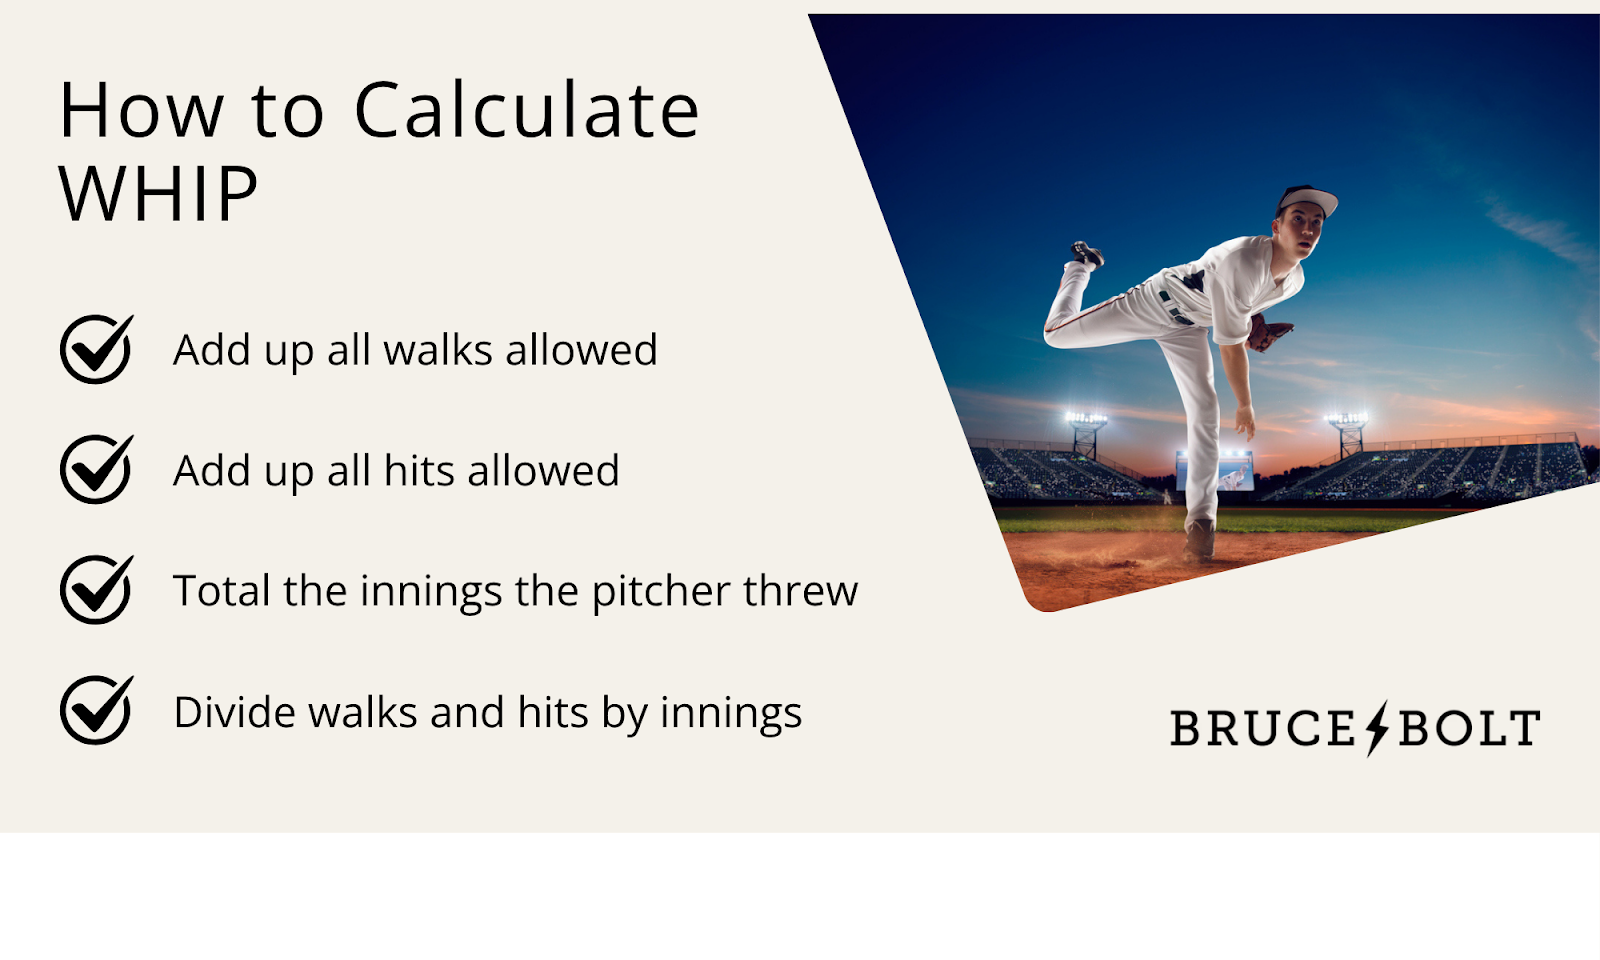
The mathematical formula for WHIP is straightforward:
WHIP = (Walks + Hits) ÷ Innings Pitched
How to Calculate WHIP
Let's walk through a practical example. If a starting pitcher has thrown 200 innings and allowed 150 hits and 50 walks, their WHIP would be:
(150 + 50) ÷ 200 = 1.00 WHIP
This means the pitcher allows, on average, one baserunner per inning through hits or walks.
What counts in WHIP:
-
All hits (singles, doubles, triples, home runs)
-
Walks (bases on balls)
-
Official innings pitched
What doesn't count:
-
Errors
-
Fielder's choice
-
Reached on strikeout
 Components of WHIP
Walks in WHIP refer to bases on balls, where a pitcher throws four balls outside the strike zone. These represent a lack of control or intentional walks. Each walk counts as one baserunner in the WHIP calculation.
Hits include any time a batter reaches base through a hit, regardless of the type. A home run counts the same as a single in WHIP calculation, as the statistic focuses on baserunner prevention rather than run prevention.
Innings pitched provide the foundation for the calculation. A standard inning consists of three outs, with partial innings converted to decimals. For example, if a pitcher records one out in an inning, that counts as 0.33 innings pitched.
WHIP Standards and Benchmarks
Elite vs. Average WHIP Performance
Understanding a pitcher's WHIP as a baseball statistic helps evaluate a pitcher's effectiveness reliably. A low WHIP under 1.00 represents elite pitching, meaning a pitcher allows less than one base runner per inning through hits and walks combined. WHIPs between 1.00-1.10 show above-average pitchers' performance, while the average pitcher in Major League Baseball falls between 1.10-1.30. Pitchers with higher WHIPs above 1.30 typically struggle to prevent baserunners consistently.
Historical WHIP Excellence
Some of baseball's most remarkable career WHIP performances showcase incredible command and dominance. Addie Joss holds the career record with a 0.968 WHIP across his 1902-1910 era. In recent years, Mariano Rivera (1.000), Pedro Martinez (1.054), and Clayton Kershaw (1.014) stand out for maintaining low WHIP statistics over long careers. The single-season record belongs to Pedro Martinez, who posted an incredible 0.737 WHIP in 2000 - allowing just 128 baserunners in 217 innings pitched.
Today's WHIP Standards
The league average WHIP typically hovers around 1.30, though this fluctuates based on era and advanced metrics. Among qualified pitchers, standouts like Max Scherzer, Jacob deGrom, and Justin Verlander regularly post lower WHIPs under 1.00 during their best seasons. Young starting pitchers like Corbin Burnes and Shane Bieber have also joined these ranks, demonstrating elite pitchers' ability with WHIPs consistently below 1.10. This advanced stat helps identify both established aces and rising talent showing superior ability to limit baserunners.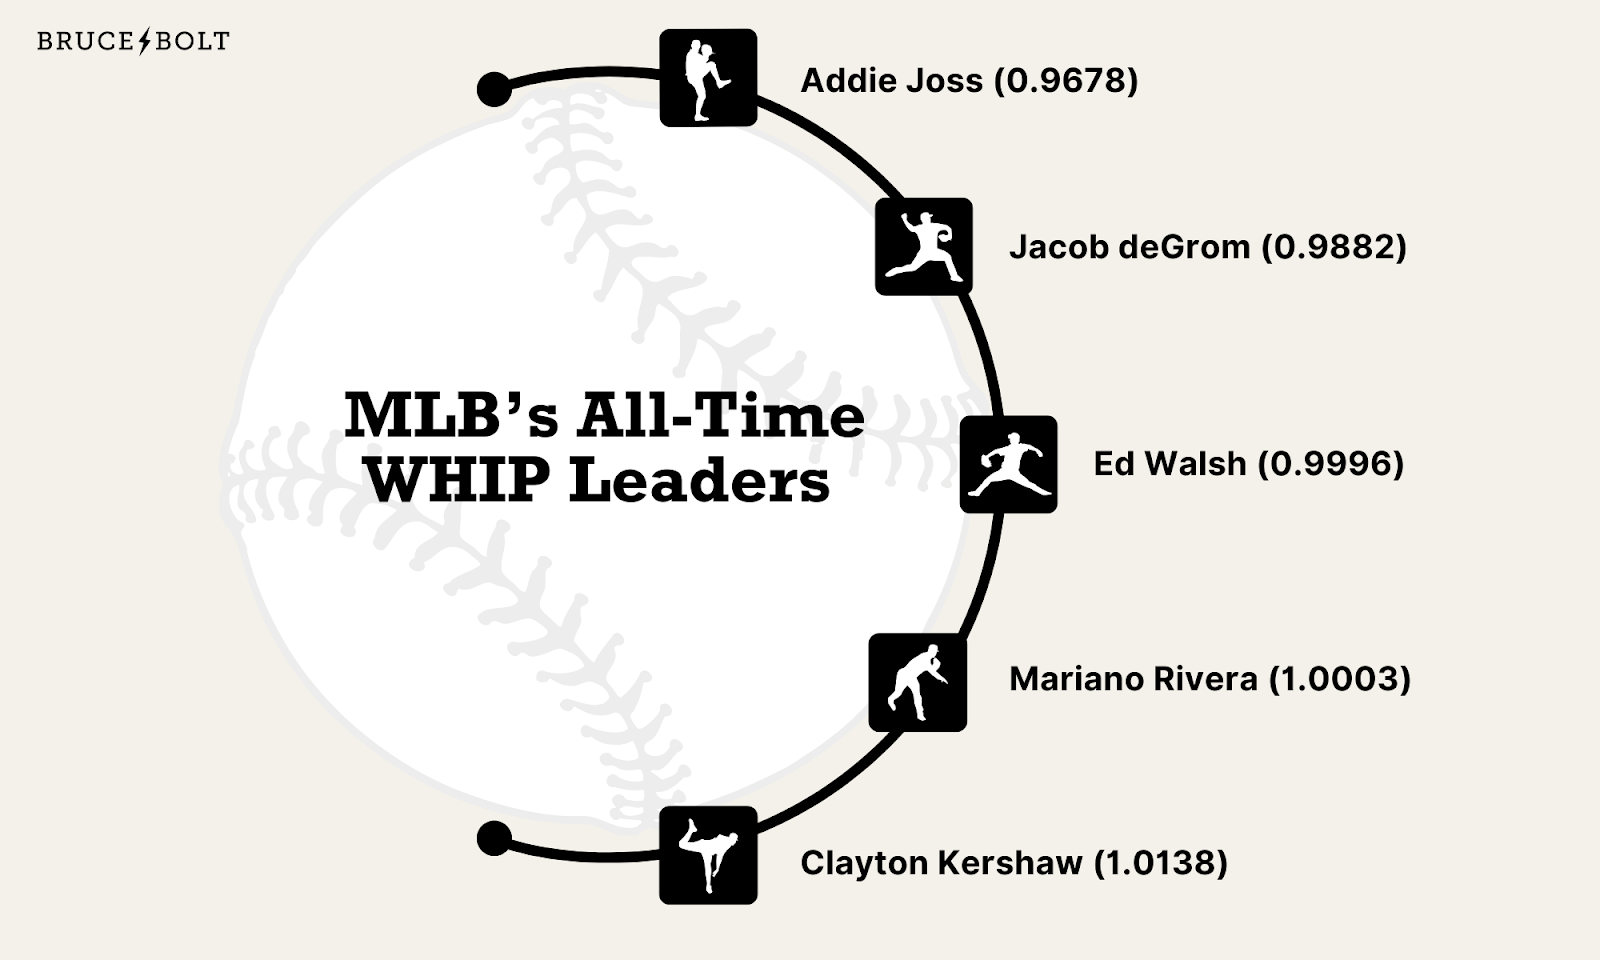
WHIP vs Other Pitching Statistics
WHIP vs Traditional Stats
A pitcher's WHIP and ERA tell different but complementary stories about pitching effectiveness. While ERA measures how many earned runs a pitcher allows per nine innings, WHIP focuses on base runner prevention. A starting pitcher might maintain a solid ERA but struggle with a high WHIP, suggesting they frequently work their way out of jams. Win-Loss records, though traditional baseball statistics, can be misleading since they depend heavily on run support and defensive play. The WHIP statistic provides a clearer picture of a pitcher's actual effectiveness.
Benefits of Using WHIP
WHIP serves as a strong predictor of future performance because it measures fundamental pitcher control. Pitchers who consistently keep fewer baserunners off base tend to maintain their success over time. WHIP is a valuable stat for measuring how well a pitcher limits baserunners, offering consistent insight across the season, though it can still be affected by factors like defense and luck. This makes it particularly useful for evaluating pitchers across different teams or ballparks.
Limitations of WHIP
The WHIP statistic has notable blind spots in its evaluation. It treats all hits equally, whether they're infield singles or home runs. Advanced metrics like WHIP ignore hit-by-pitch situations and don't account for the timing of walks and hits. A pitcher who allows multiple base runners in a single inning might be more problematic than one who spreads them across different innings, yet both could have identical WHIPs.
Complementary Statistics
For a complete evaluation of a pitcher's ability, combine WHIP with other advanced stats. Field Independent Pitching (FIP) helps assess how well a pitcher performs independent of their defense. Strikeout-to-walk ratio shows control and dominance, while batting average shows how often hitters get hits off a pitcher. Using these baseball analytics together creates a more accurate picture of pitching effectiveness than any single metric alone.
Gear Up With BRUCE BOLT
For baseball fans looking to deepen their understanding of baseball analytics, tracking WHIP is an excellent starting point. It's straightforward to calculate, easy to interpret, and provides immediate insight into a pitcher's ability. Whether you're evaluating your fantasy baseball roster or analyzing your favorite team's starting pitcher rotation, WHIP remains a foundational baseball statistic in modern analysis.
Every serious ballplayer knows that top performance starts with reliable gear. At BRUCE BOLT, we make equipment built to meet the demands of every position. Whether you're blocking pitches behind the plate, turning two at shortstop, or tracking fly balls in the outfield, our gear is made to keep up.
Our premium batting gloves are built for players who expect more from their gear. That means better grip, longer-lasting durability, and all-day comfort when the pressure is on. Made with top-tier materials, they perform in tough practices and game-day moments.
We also offer protective gear that keeps you focused and ready to compete. From sliding mitts to elbow guards, every piece is designed to help you play with confidence and stay protected.
Bring your best to every play. Gear up with BRUCE BOLT.